
Project reporting is about business intelligence. It is software that provides real-time analytics for the monitoring of all aspects of a project, including project status, tasks, timesheet, workload, expenses and more.
The best project reporting software will allow you customise reports both in look, content and delivery method.
When Would You Use Project Reporting Software?

As a project manager, part of your role is to report on the progress of the project to the executives in the company, the client themselves and the team members you work with.
Each of these reports will have a purpose, whether it is to justify time and cost, to report on progress made, to consider the impact of decisions made, to manage performance, and many more.
These reports are both a bind and a necessity and so you need a platform that can make this reporting as accurate, relevant and easy as possible.
The essential features you would be looking when buying your project reporting software include:
Single click reporting
This is the ability to click once and get the information you need. You don’t want to spend hours formatting your reports – you just want to capture the information in an easy-to-read and well-organised format.
The best platform will offer a wealth of standard reports that are borne out of project management experience, which mean you can create them with one click of the mouse.
Customisable
When generating reports, you need to make them suitable for use in your businesses materials. The different stakeholders who need reports need different data and different presentation of the same data.
Therefore, the best tools will give you access to easy customisation. This is often achieved using filters, which allow you to reflect only the data that is applicable to the situation.
Intuitive
The interface needs to be user-friendly. You shouldn’t need too much training to use the reporting features of project management software.
The best platforms use the same layout and tools as popular productivity applications, so you can apply the same skills and knowledge across the platforms.
Integration
You Project Reporting Platform needs to integrate with your other business applications if it is going to be a useful software.
The platform should use an Application Program Interface (API) which allows different software to interact with each other.
The reason this is so important is that you could end up with data in lots of isolated silos and without integration, you will not be able to report on all the aspects of a business that is needed.
Easy Import/ Export
If there is data in a tool that cannot integrate then you need a report software that allows easy import and export of data. This is usually achieved using CSV files that can easily move data between packages.
This might only be important at the point of implementation of the project reporting platform but it is still an essential tool.
Share options
In order for the reporting to be useful, it needs to be open for sharing with a range of stakeholders. This might mean you need to create a PDF or an Excel File or an open source document.
Furthermore, it might be necessary for you to create a presentation using the data, so you can communicate progress. It should allow you to attach the file to an email or to print and present the findings at a meeting.
Real-time data visibility
For the platform to be useful you need an easy-to-read dashboard that allows you to pull in data that keeps you updated in real-time.
This might be a status update from team members on a single screen or a representation of time used, so that analysis can be done on efficiency.
This data cannot be historic, it is data that represents that moment in the project and should be the data that you most need to see.
Automation
The final thing you hope from your project reporting platform is the ability to set up automated reporting that are sent to you when you designate.
The tool should let you design the reports you need regularly and then have these scheduled for production. These should be able to be emailed to you or a notification set when they are ready to view.
This is an important way to avoid the missing of deadlines or important details that might otherwise be overlooked.
Which Platforms To Use and How To Use Them
Here are some project reporting platforms that you can use to create business intelligence on your project.
Genius Project
This tool is specifically designed for the reporting, analysis and delivery of information. Not only does it contain report creation tools but also analysis tools. This analysis can then be delivered to stakeholders in different forms.
The dashboard is customisable. You can select which graphics and data views you want available to you. These dashboards are then added to the navigation of the site, so they can be found easily.
You can create ad-hoc reports using query, filter and groups. These reports can then be delivered in Microsoft Excel, so it is shareable with all stakeholders. You can also export as a PDF.

Genius Projects stores a series of predefined project dashboards covering most areas of project tracking and reporting, which can be opened and then customised to your needs.
You can build your own fully customised reports using the Genius Chart report generator, which acts like a wizard for creating the report in the exact way you need it.
Zoho Projects
Zoho is a full project management suite and part of this is Project reports. The reports in Zoho give a visual representation of the project and how it is moving forward.
You can use graphs, images and charts that can be used however you need to present information. The project reports are online and easy to interpret, making them an easy communication tool with a range of different stakeholders.

The sort of project reports you can create include a project status report, which is represented as a Milestone Gantt chart – this can also present subtasks as well as tasks.
You can generate a project sequence report using a chronology Gantt – which can be formatted using a simple drag and drop. There is a resource view, which allows you to see how each team member is using time.
Zoho reports contains 50 ready-made reports and dashboards, which allows you to organise the data in any way you wish and make this visible to the team and beyond.
Asana
Asana is a project management platform that handles all aspects of a project. It also includes a powerful reporting tool that provides daily progress reports on all aspects of the project.

To use Peloton, the reporting tool, with Asana you can:
- Add team to your project dashboard so everyone can get a high-level view of the status of the progress.
- You can drag and drop in project cards and put these into a priority order or order them by the product owner or by status.
- Dashboards can then be viewed in meetings to help with the sharing of data. These dashboards can include charts and text, as designed by you.
- To create the custom view and reports you can use the Search View to find the information you would like displayed.
- The dashboards can be integrated with Google Sheets – this integration allows you to create custom reports and visualizations on this platform. In Google Sheets, you can print off your report or share a link for clients or team to view wherever they are.
eazyBI
Basecamp is a full project management platform, which means all your information about your project is in one place. You can import your Basecamp data into easyBI and create reports and dashboards in just a few clicks.
This will let you analyse project milestones and to-do items.
You can get an overview of all comments related to a project, all messages and all events, as well as view the status of a team member at any time, or the activity within a time period.
There is also an eazyBI available for Jira.

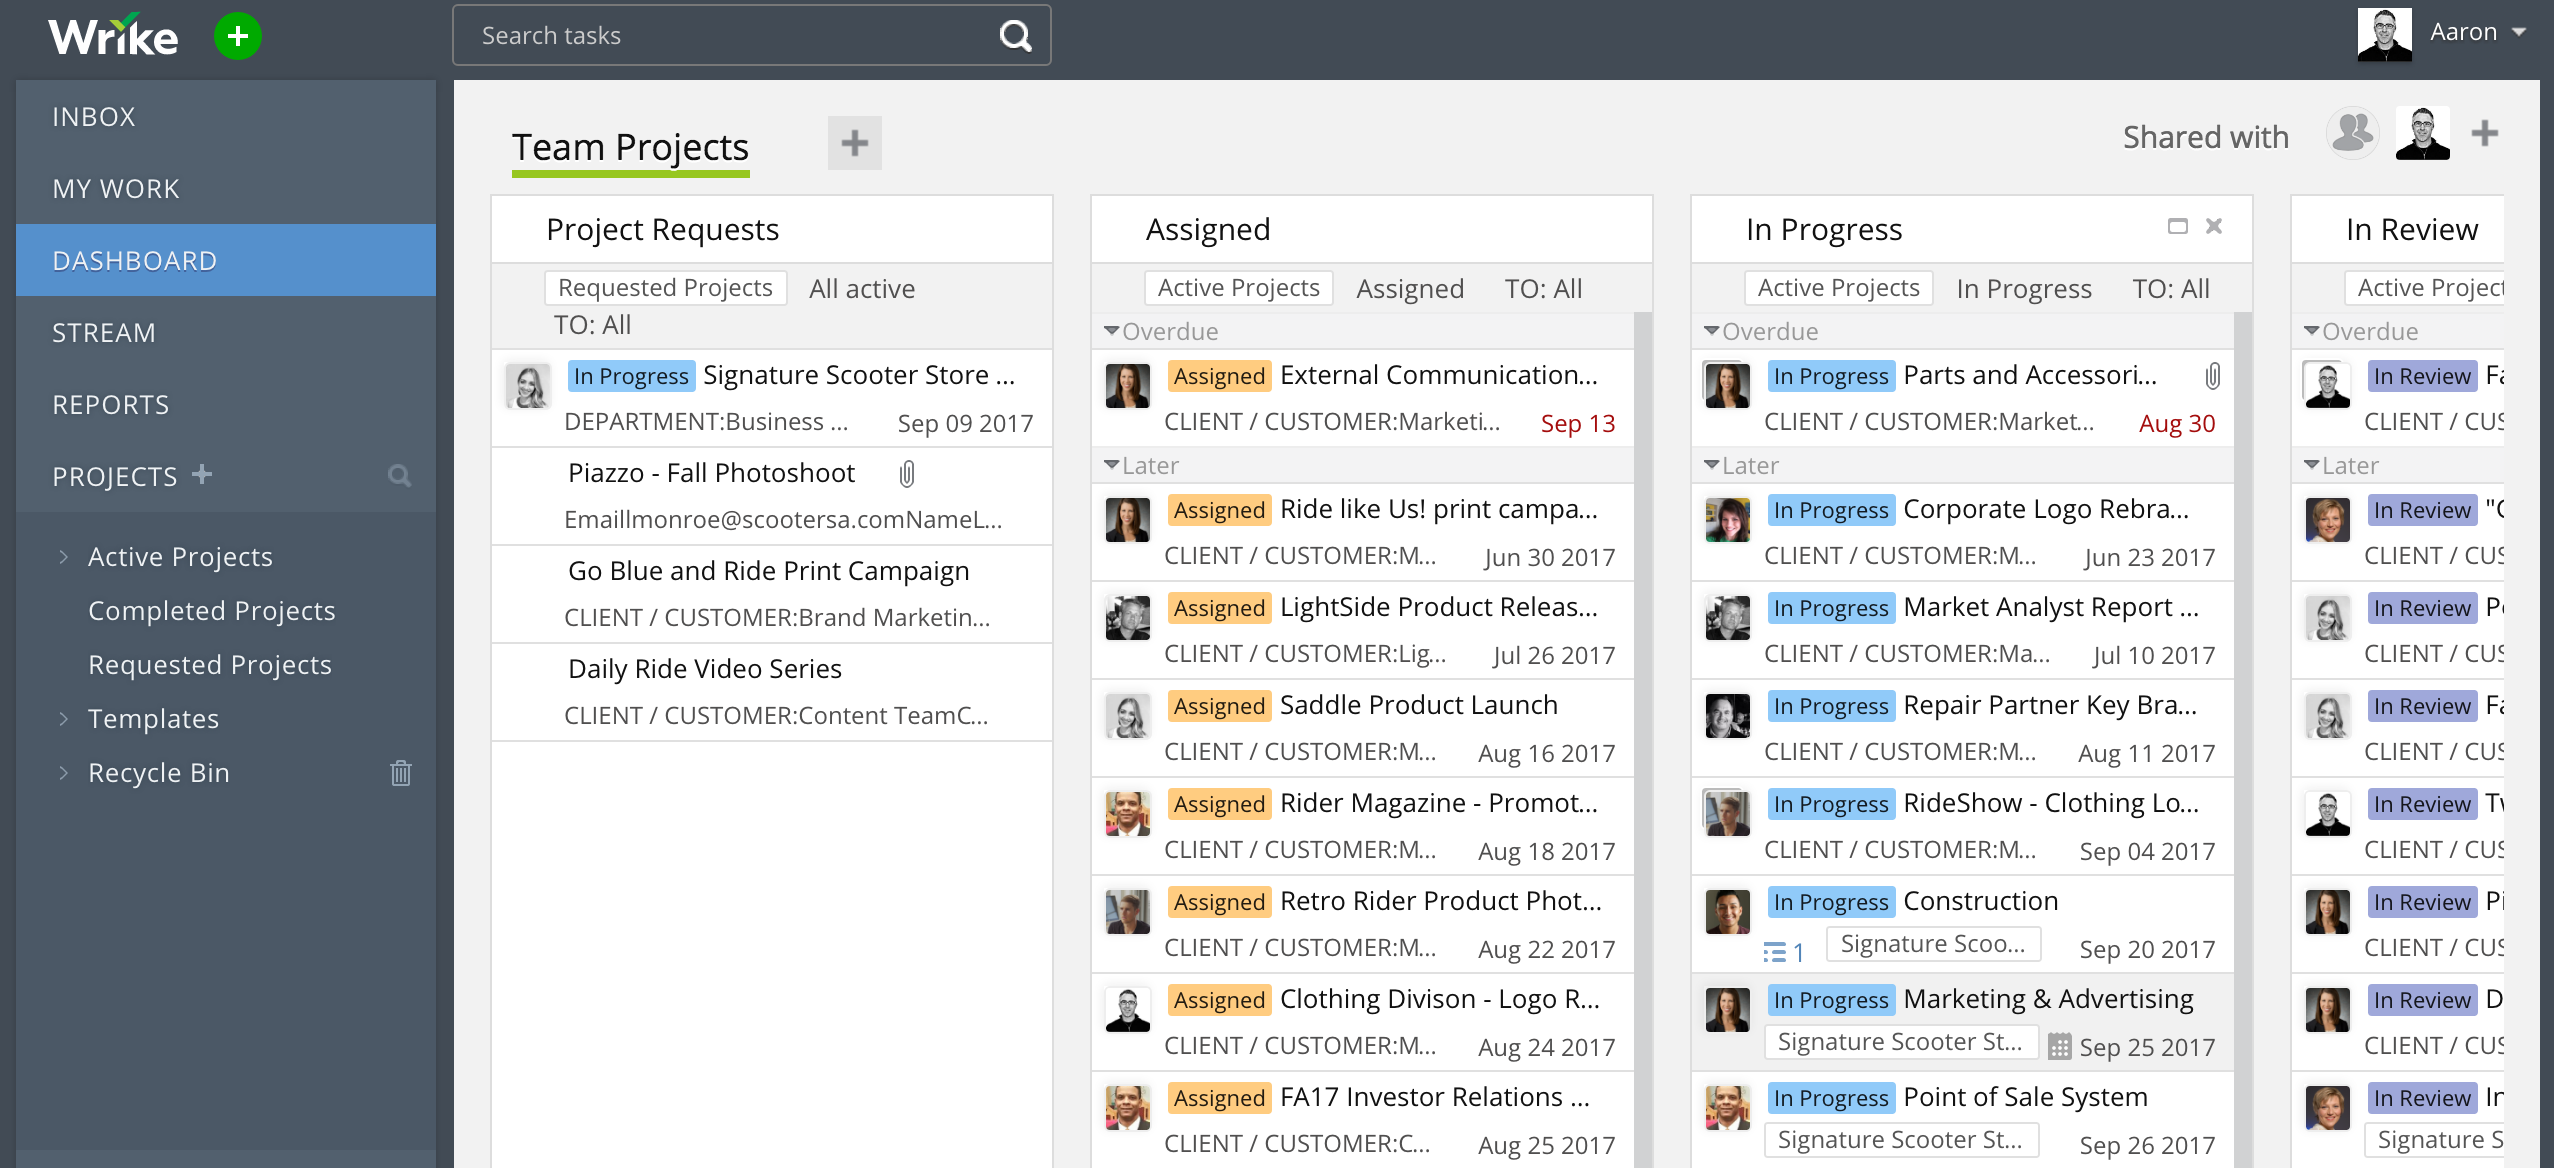
Wrike
Wrike has an inbuilt reporting tool as part of its project management platform.
To create a report in Wrike is simple:
- You select reports from the tab at the top of the workspace.
- You then click the new report from scratch option or select one of the report templates.
- You can then use the report builder to specify the data you want to add and once the parameters are set you can click save and view the report.
This new report will be added to the top of the list of reports in your section of the site, called your Workspace.
The report builder has four columns that walk you through the process of creating your report and offers a series of filters that ensure you get the information you need.
Overall
Reporting is a crucial part of project management and as such can take up a lot of time when other work can be done. There is software available that makes the creation of these reports as simple as just a few clicks.
This data can be real-time or historical, can be shared with team-mates or clients. Therefore, it is an essential PM tool.
If you want to see more choices, see our guide to the best project management software for a better overview.